AI for inventory management in wholesale: better ordering with the data in your ERP
The data already sits in your ERP. How an order proposal calculates, which items are difficult, what the buyer keeps doing and how to roll it out without risk, with a worked example for your own figures.
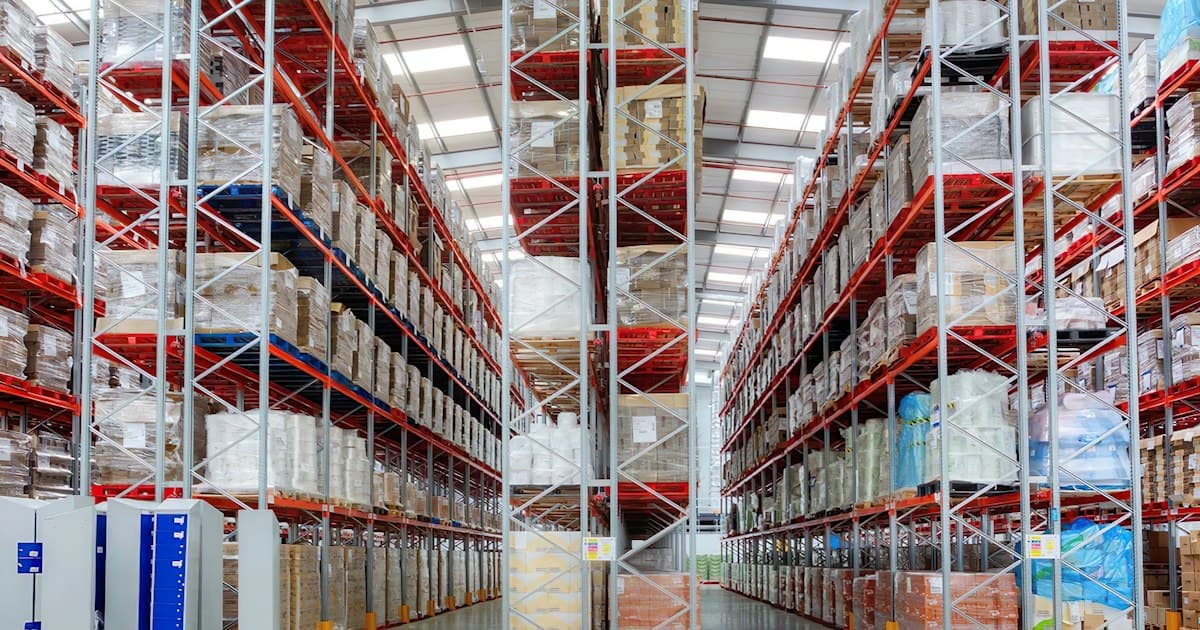
In practice, AI for inventory management in wholesale means three things: forecasting per item what you will sell in the coming weeks, calculating a safety stock and a reorder point from that, and giving the buyer an order proposal every day to review. The data you need for this almost always already sits in your ERP. So you do not have to buy a new system to get started. The gain is in less money on the shelf, fewer orders you cannot fill, and fewer items lying idle until they have to be written off. The buyer keeps making the decisions.
This piece goes deeper into stock. Our broader piece on AI in wholesale explains why stock is usually the first place the money sits, alongside purchase prices and margin. Here you read how an order proposal calculates, which items are difficult, what data you need, what the buyer keeps doing, how to roll it out without risk and how to measure whether it pays off. With a worked example you can redo with your own figures.
Why stock is the place to start
According to Statistics Netherlands (CBS, table 81589NED), the Netherlands has 65,885 wholesale companies in the third quarter of 2026. Of those, 1,575 have fifty or more people working there: 1,385 with 50 to 250 and 190 with 250 or more. That is the group this piece is written for. Large enough for a purchasing department with a few buyers and an ERP holding years of transactions. Too small for a data department of its own.
CBS also measures how companies use AI (table 86119NED, covering 2025). In trade as a whole, which includes wholesale, 47 percent of companies with 50 to 250 people use some form of AI. That sounds like a lot. Look at what they use it for, and the picture changes. 24 percent use AI for marketing or sales. 13 percent use machine learning for data analysis. 5 percent use AI for logistics. Across all sectors, 4 percent of companies that use AI apply it to logistics, CBS reported in December 2025. So most AI use sits in text and communication, and much less in the numbers the business runs on. Note that this covers all of trade, including retail and motor trade. CBS does not publish a separate breakdown for wholesale alone.
For stock, that is an opportunity. An order forecast is statistics on your own sales history, and you already have that. The outcome is also easy to check: within a few weeks you know whether the forecast was right, because actual sales show it.
What an order proposal actually calculates
Many buyers now order using a minimum and a maximum per item in the ERP. Those numbers were set at some point and rarely updated. An AI-based order proposal does essentially the same thing, but recalculates the numbers every week based on what actually happens. It needs three building blocks for that.
The expected demand per item. How much you will sell in the coming weeks, taking trend, season and special orders into account. This is where the AI part sits. A model looks at years of sales history and learns which pattern applies to each item.
The safety stock. The extra stock you hold because demand and lead time never come out exactly as expected. The less predictable the item, the larger that buffer.
The reorder point. The moment you order: the expected demand during the lead time plus the safety stock. When stock, including what has already been ordered and is on its way, drops below that point, the item goes into the proposal.
An example with one item, so you can see how it calculates. Suppose an item sells 40 units a week on average. Demand fluctuates, with a standard deviation of 12 units a week. The supplier delivers in 2 weeks. Over those 2 weeks you expect to sell 80 units. The fluctuation over that period is 12 times the square root of 2, which is about 17 units. If you want to avoid running out in 95 percent of lead times, you multiply by 1.65. The safety stock is then 1.65 times 17, rounded to 28 units. The reorder point is 80 plus 28, so 108 units.
That is not new mathematics. The difference from today is that the system does this for every item every week, with current demand and current lead time. A buyer with 6,000 items cannot keep that up by hand. That is why the minimums in the ERP often still show what someone entered three years ago.
 A buyer at work between the racks. The order proposal does the arithmetic, he decides what goes out.
Five kinds of items that make it difficult
A forecast works well on items that sell regularly and in reasonable quantities. A wholesaler always has other items that behave differently. A good proposal treats them differently, and the buyer needs to know which ones they are.
Seasonal items. Garden products in spring, heating in autumn, party supplies in December. A model needs at least two full years of data to recognise a season. With one year it mainly learns what happened to occur that one year.
Slow movers. Items that sell a few times a year, often in varying quantities. An ordinary forecast fails here, because the average says little. For these items the real question is whether you want to hold them in stock at all, or supply them to order. That is a choice for purchasing and sales together.
Obsolete stock. Items that have not sold for months and probably will not sell again. A system can flag them early: no sales in six months while stock is still on the shelf. What you do with them, return them to the supplier, mark them down or offer them to a regular customer, is human work.
Varying lead times. A supplier who sometimes delivers in one week and sometimes in four costs you extra stock. Take the same item as above, but now with a lead time that averages 2 weeks and varies by half a week. The fluctuation in demand during the lead time then rises from 17 to about 26 units. The safety stock becomes 1.65 times 26, rounded to 43 units. The reorder point rises to 123. That one unreliable supplier costs you 15 extra units of stock on this one item. Across hundreds of items from the same supplier, that is worth a conversation.
Promotions and project orders. A promotion at a customer or a large order for a project shows a peak that does not come back. If the model treats that peak as ordinary demand, it orders too much afterwards. That is why the data needs to show which sales belonged to a promotion or a project.
What data you need
Almost every wholesaler of this size already has this data. It just does not always sit neatly together, and not every field means what its name suggests.
| Data | Where it usually sits | Why you need it | Where it often goes wrong |
|---|---|---|---|
| Sales history per item per week | ERP, sales orders or invoices | The basis of every forecast | Returns and credit notes not properly netted |
| Requested delivery date and missed orders | ERP, order lines and backorders | Without it you only see what you could deliver | Orders you could not fill are recorded nowhere |
| Lead times per supplier, promised and actual | ERP, purchase orders and receipts | Needed for reorder point and safety stock | Only the promised lead time is in the system |
| Open purchase orders | ERP, purchasing module | What is on its way counts as stock | Old orders that were never closed |
| Promotions, projects and one-off orders | ERP, order type or a separate overview in sales | Keeping peaks that do not return separate | Only in the account manager's email |
| Item status and replacement items | ERP, item master data | A replaced item no longer has real demand | Successor not linked to its predecessor |
| Minimum order quantity and packaging | ERP, supplier data | The proposal has to be orderable | Outdated agreements with suppliers |
Two rows deserve extra attention. The first is the demand you could not fill. Your sales history shows what you sold, not what customers wanted. If an item was out of stock for three weeks, demand in those weeks looks like zero. A model that learns from that will order too little next time. The second is the actual lead time. Many ERPs know the lead time the supplier promises, but not the one they achieve. The date of receipt is in there, though. The difference between the two is exactly what you need.
You do not need to buy a new ERP for this. What you do need is to write down per field what it means and which source wins when two sources contradict each other. How to approach that without a migration project is described in getting your data in order for AI.
A worked example to fill in with your own numbers
This example is made up and is meant as a method of calculation. Replace every number with your own company's.
Suppose a wholesaler with 120 employees. Its stock has an average value of 3,000,000 euros, at cost price. The cost of goods sold is 15,000,000 euros a year. Stock turnover is then 15,000,000 divided by 3,000,000, which is 5 times a year. An item spends on average 365 divided by 5, which is 73 days on the shelf.
Holding costs. Stock costs money, even when it sits still: interest or forgone interest on the capital, space, insurance, and items that age. Suppose those costs together come to 20 percent of stock value per year. That is 600,000 euros a year. Use your own percentage here, because it varies widely between companies and products.
Ten percent less stock. Suppose a better order proposal lowers stock by 10 percent, with the same level of delivery to customers. That frees up 300,000 euros of working capital, once. Holding costs drop by 60,000 euros a year. Turnover goes to 15,000,000 divided by 2,700,000, which is about 5.6. An item then spends on average 66 days on the shelf instead of 73.
Fewer orders you cannot fill. Suppose the wholesaler delivers 120,000 order lines a year and 95 percent of them can be shipped straight from stock. Then 6,000 lines cannot be delivered, or not on time. If that goes to 96 percent, it is 4,800, so 1,200 fewer. At an average line value of 250 euros, that is 300,000 euros of revenue. Not all of that revenue was lost, because some customers simply wait. So only count the part that actually went to a competitor. If that is half, and the gross margin is 25 percent, you are looking at 150,000 euros of revenue and 37,500 euros of margin.
Purchasing hours. Suppose three buyers each spend an hour and a half a day checking standard orders, and the proposal takes an hour per person off that. Over 220 working days that is 3 times 1 times 220, which is 660 hours a year. Those hours do not come off the payroll. They go to suppliers, exceptions and better agreements.
| Component | Calculation | Result in this example |
|---|---|---|
| Working capital freed, one-off | 10% of 3,000,000 | 300,000 euros |
| Lower holding costs, per year | 20% of 300,000 | 60,000 euros |
| Extra margin from fewer unfilled orders, per year | 1,200 lines x 250 euros x 50% x 25% | 37,500 euros |
| Purchasing hours for other work, per year | 3 buyers x 1 hour x 220 days | 660 hours |
Ten percent less stock is an assumption. At a wholesaler whose minimums have not been updated in years, it can be more. At a wholesaler that already manages tightly, it can be less. You only know after the shadow period described below. How to set up a calculation like this for your board is described in calculating AI ROI with your own numbers.
What the buyer keeps doing
A buyer does a lot more than place orders. The order proposal takes over the arithmetic. The rest stays with the buyer, and more time opens up for it.
| Task | What the system does well | What the buyer keeps doing |
|---|---|---|
| Standard orders | Calculating per item what to order and how much | Reviewing and approving the proposal |
| Exceptions | Flagging deviations, such as a sudden peak or an item that stopped selling | Finding out what is behind it and deciding |
| Suppliers | Showing which supplier is structurally late | Having the conversation and making better agreements |
| Obsolete stock | Flagging items without sales early | Choosing between returning, marking down or keeping |
| Promotions and projects | Recognising peaks from the past | Knowing what is coming next month and entering it |
| Range | Showing which items earn little | Weighing what a customer needs, even if it sells slowly |
Two things make the difference. The first: the buyer must be able to override the proposal, and that override must stay visible, with a short reason. Those reasons are valuable. They show what the system does not know, and they make readable the knowledge that now sits only in the head of an experienced buyer. What happens when that buyer retires is a risk many companies underestimate.
The second: the time that is freed up stays with the buyer. If that time immediately goes into more items per buyer, cooperating well gets punished. A buyer who gets time for suppliers and exceptions gets better at the job. That is what it is meant for. Why it matters so much to involve your own people from the start is explained in getting more out of the people you already have.
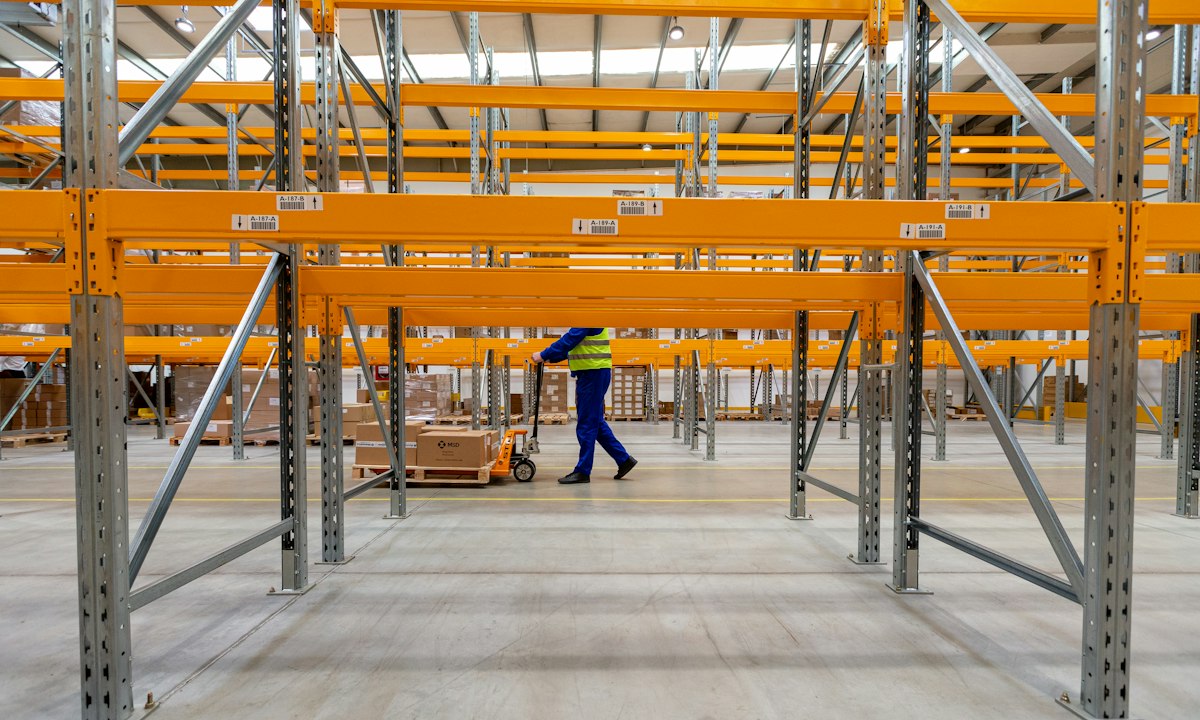 Empty rack positions in a warehouse. Ten percent less stock with the same delivery is working capital set free again.
A rollout you can reverse
Start with one product group, not the whole range. Choose a group with many items and a clear pattern, one that purchasing says should be more predictable than it is now. Every step below is reversible: if it does not work, you simply order the way you order now.
Step one: running in the shadow. For two to three months the system makes an order proposal every week, and the buyer orders as always. Nobody uses the proposal. At the end of each week you put the two side by side. What would the system have ordered, what did the buyer order, and what was actually sold afterwards? That is the most honest test there is, and it costs almost nothing.
Step two: proposal as a starting point. The buyer starts with the proposal instead of an empty list, and adjusts what is wrong. Every adjustment gets a reason in a few words: promotion at customer, supplier discontinuing item, project in preparation. You measure how much of the proposal stays unchanged.
Step three: expanding. Only when the first group has run well for a few months, including through a busy period, do you add the next group. Standard items with stable demand can eventually be ordered without intervention, within limits the buyer sets. Seasonal items, slow movers and large amounts remain a proposal that a person approves. That is the principle of human on the loop.
Agree in advance when you stop. For example: if after three months in the shadow the proposal does not score better than the buyer on stock and delivery combined, you do not move on to step two. You first find out why. Usually the problem is in the data.
How to measure whether it pays off
Start measuring before you change anything. Three months of baseline on the chosen product group is enough to see the normal fluctuations. After that, measure the same points in the same way.
| Measure | How you calculate it | Why it matters |
|---|---|---|
| Stock value | Average stock at cost price, per product group | The money sitting on the shelf |
| Stock turnover | Cost of goods sold per year divided by average stock value | Shows how quickly stock turns back into money |
| Service level | Share of order lines that could be delivered straight from stock | The customer notices this first |
| Out-of-stock | Number of item-days an item stood at zero | Captures the demand your sales figures do not show |
| Obsolete stock | Value of items without sales in six or twelve months | Shows whether less new idle money is being created |
| Purchasing hours | A simple log kept by the buyers themselves | Shows whether time is freed up, and for what |
| Share of proposal that stands | The log of adjustments | Shows where the system learns and where it does not |
Look at all of these at once. Lower stock with a lower service level means you have shifted the cost to your customer. A higher service level with higher stock is no improvement, you could have done that without a model. The goal is less stock with equal or better delivery.
Where it goes wrong in practice
The model learns from sold-out weeks. If sales history shows zero while the item was sold out, the model forecasts too little. Mark those periods.
The adjustments disappear. A buyer who sees that their corrections are needed again next week stops correcting. Then the system misses exactly the knowledge that should have made it better.
The whole range too quickly. A few good months in one group say little about another group with a different pattern. Expand step by step.
Nobody inside the company understands the proposal. An outside party can build it. If that party leaves and nobody can explain why the system proposes 200 units, you come to a standstill at the moment it matters. Make sure one of your own buyers or controllers knows how it calculates.
Where to start
Which package or approach you choose comes later. First you want to know where your organisation stands now: whether your data connects, whether there are people who can carry this, and whether stock really is the first step. The AI-Foto is a free self-scan. Ten minutes, twelve questions, and you see where your organisation stands.
About this page
The number of wholesalers and the breakdown by size class come from CBS table 81589NED (companies by sector and size class, wholesale SBI 462 to 469, third quarter of 2026). The figures on AI use come from CBS table 86119NED (ICT use by companies, 2025) and cover all of trade (SBI G), not wholesale alone. The national figures on what companies use AI for are in the CBS news release of December 2025. The safety stock formula is the common simplification that assumes normally distributed demand. The worked example is made up and intended as a method of calculation, not a promise. This is the situation as of 5 October 2026.
Frequently asked questions
Sources
- CBS 81589NED: Bedrijven naar bedrijfstak en grootteklasse, groothandel (SBI 462-469), derde kwartaal 2026— opendata.cbs.nl ↗
- CBS 86119NED: ICT-gebruik bij bedrijven naar bedrijfstak en bedrijfsgrootte, 2025 (AI-gebruik in de handel)— opendata.cbs.nl ↗
- CBS, december 2025: Bedrijven gebruiken AI vaakst voor marketing of verkoop— cbs.nl ↗
Tell us what you need.
We respond within 24 hours, from a real human.
Get in touch